Vim can work with GDB to debug C++ programs. This feature works in Vim version 8.1+. In this blog post, we’ll go through debugging C++ in Vim.
Setting Things Up
You need to load the plugin using the command:
:packadd termdebug
You have to do this every time you want to debug. If you want this to happen automatically, add the command to your .vimrc.
In vimrc:
packadd termdebug
The Sample Program
The code below is for the sample program that we are going to debug. Open vim and type it. We are going to save it as hello.cpp
in hello.cpp
#include <iostream>

using namespace std;

int main() {
    cout << "Hello world!" << endl;
    int age = 20;
    cout << "Your age is: " << age << endl;
    return 0;
}
Compiling It:
We are going to compile the program using g++:
in your terminal:
$ g++ -g hello.cpp -o hello
The -g flag tells g++ to produce debugging information that gdb can work with.
Debugging
Loading the Program
Assuming you still have the program open in vim, we can start debugging by either of these two ways:
Variant 1
Termdebug accepts the program name as the argument. In our case, we compiled hello.cpp to hello.
:Termdebug hello
Variant 2
The argument is optional so you can still start the debugging environment by just typing:
:Termdebug
In this case, however, we have to explicitly make GDB know the file/program we are going to debug:
in the GDB window inside of vim:
(gdb) file hello
Running the Program
Once you have started Termdebug, you can run it either of the following two ways:
- Through a Vim command:
:Run
- In the
GDBwindow:
(gdb) run
Here is a screenshot of my Vim environment at this stage:
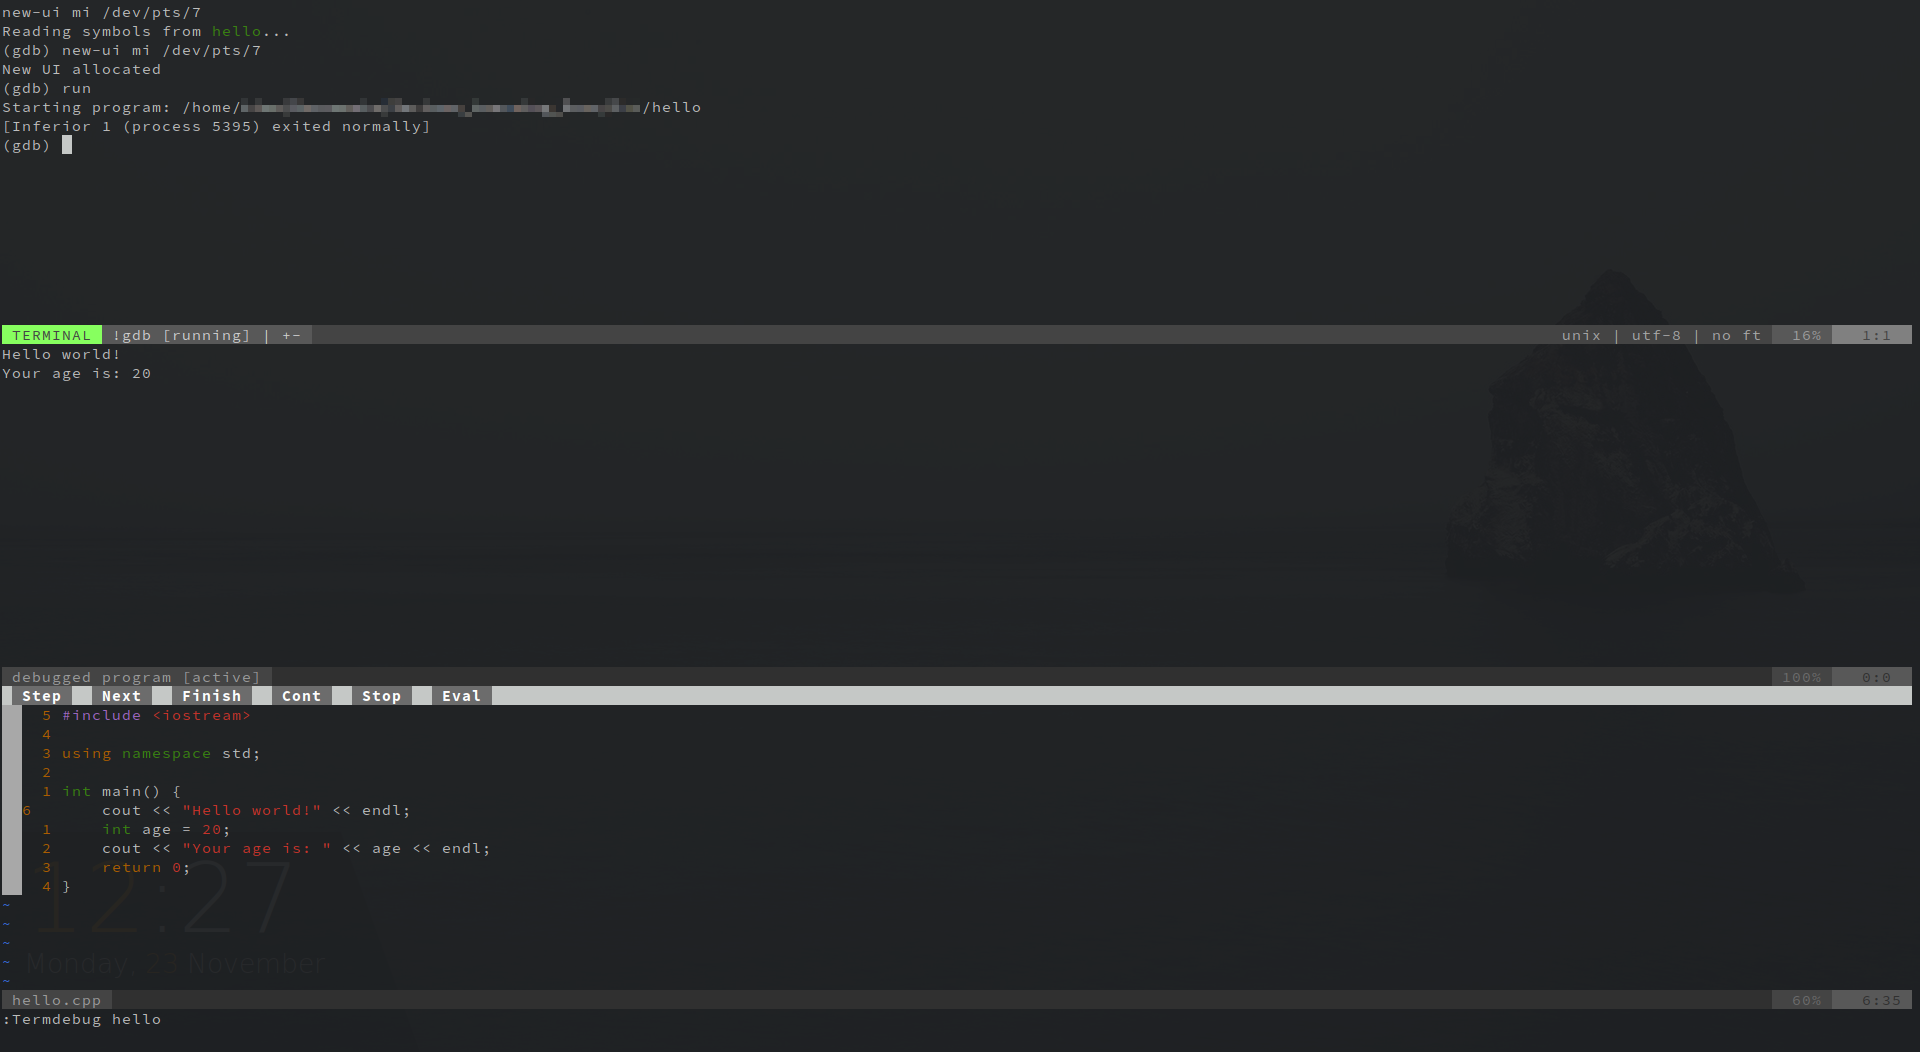
The top window in the image above is for interacting with gdb. The middle window shows the output from our program when run. The bottom window is the editor window and as you can see, our code is displayed there. The buttons on top of this window (Step, Next, Finish, etcetera) are clickable.
You can cycle through the windows using CTRL+W+W or CTRL+W+H/J/K/L.
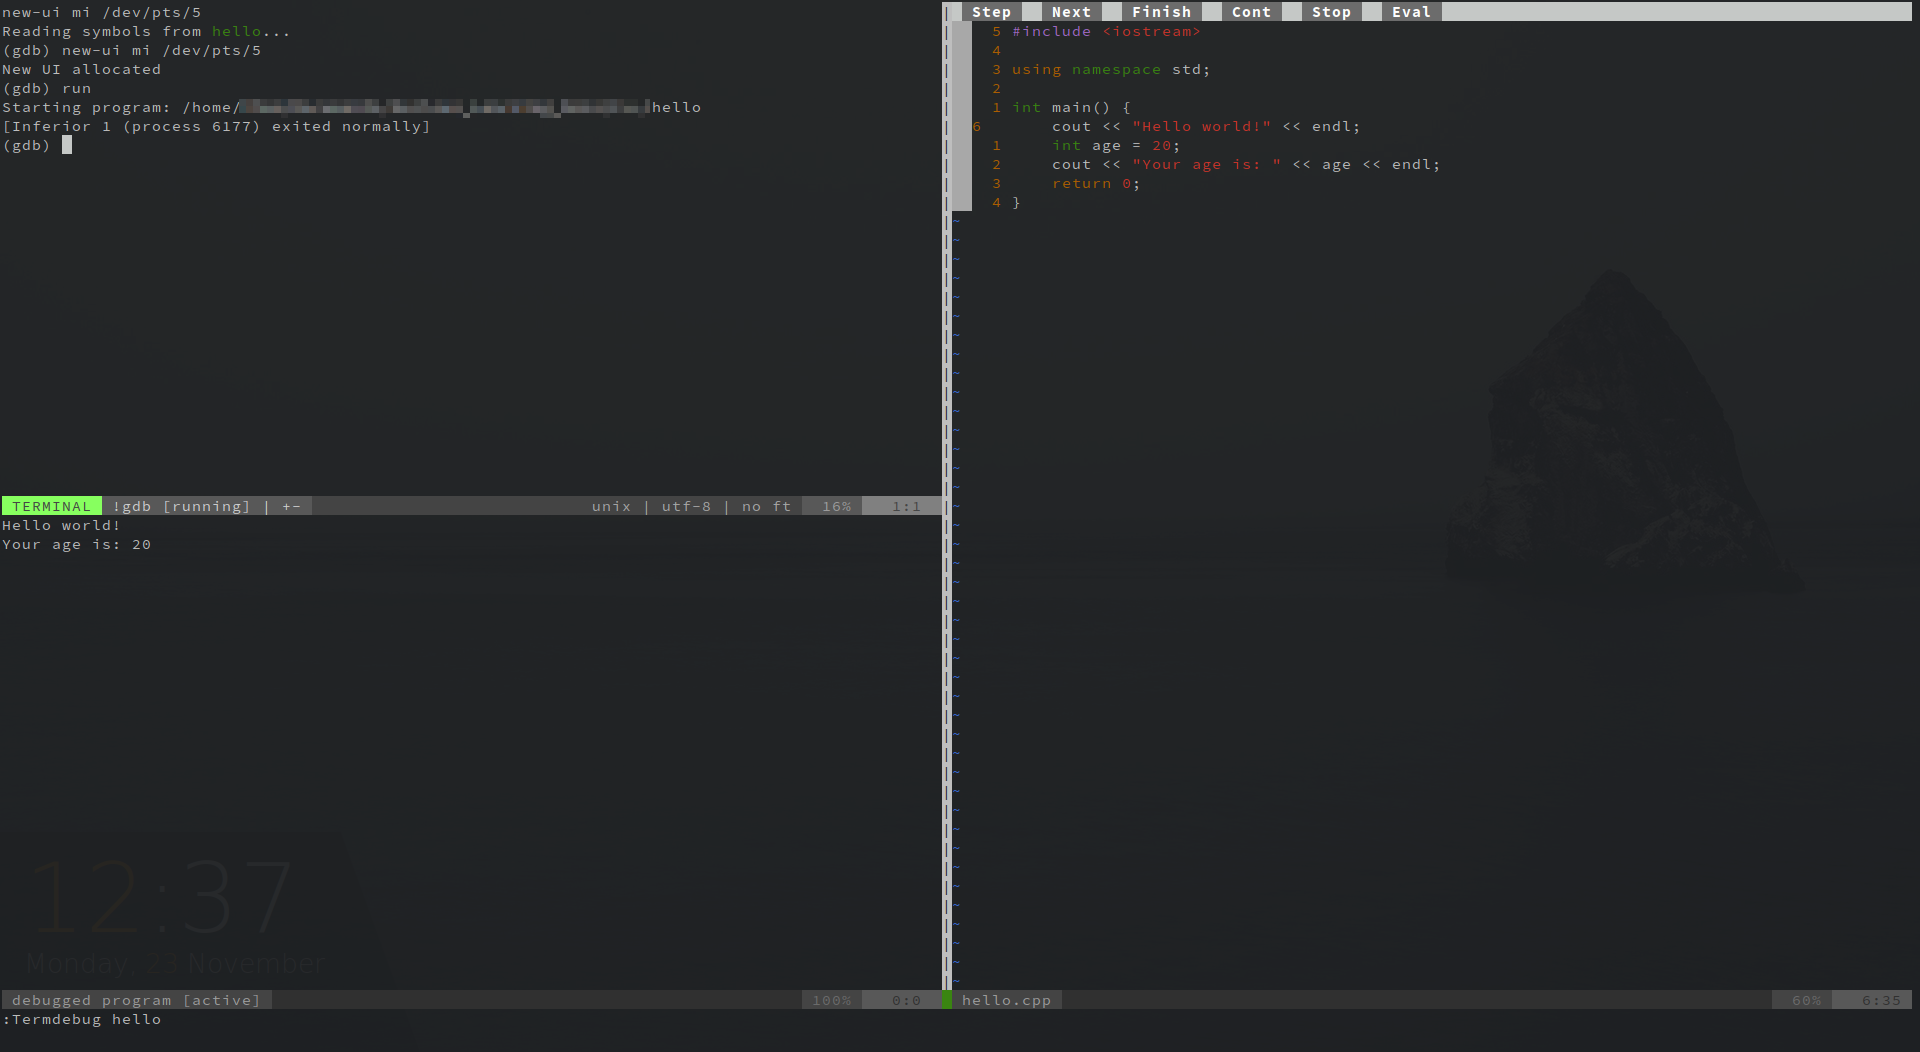
The arrangement of windows above isn’t my favourite, to make yours look like mine does below, add the following to your .vimrc:
let g:termdebug_wide=1
When you close vim and open it again then run Termdebug, it will look like:
Now let’s see how to quit:
Quit Debugging
To quit debugging, type the quit command in the gdb window:
in the GDB window:
(gdb) quit
Debugging Session
Let us now modify our program a little bit to look like this:
#include <iostream>
#include <string>

using namespace std;

int main(int argc, char **argv) {
    cout << "Hello world!" << endl;
    int age = 20;
    cout << "Your age is: " << age << endl;

    if(argc > 1) {
        cout << "Command line argument: " << argv[1] << endl;

        string name = argv[1];
        if(name == "world") {
            cout << "We are the world, We are the children" << endl;
        }
    }

    int sum = 0;
    for(int i=0; i <= 5; i++) {
        sum += i;
    }

    cout << "The sum of 1 to 5 is: " << sum << endl;
    return 0;
}
The program now checks if there is a command-line argument and if there is one it prints it out. Compile it. You can do this from vim using !:
:!gdb hello.cpp -g -o hello
Load the program:
:Termdebug hello
Command line arguments
By seeing argc and argv you already know that this program accepts command line arguments, ideally one, for this program. It could be any arbitrary text. To pass the command line arguments, we could do either of the two:
- Through Vim’s
Argumentscommand.
:Arguments world
- In the future should you want to pass multiple arguments to another program, you could still do something like:
:Arguments -d hello -n 8 --some-arg world
- Through
gdb. This can be done usingset args
set args world
- In the future if you wanted to run some program that accepts several command-line arguments, you could:
(gdb) set args -d hello -n 8 --some-arg world
Setting and Clearing Breakpoints
Now that the program is loaded, you can set breakpoints either in the editor or in the gdb window:
In the Editor Window
Move the cursor to the line you want to set the breakpoint, then enter the :Break command. In our sample program, we can navigate to line 15 then run :Break.
To clear a breakpoint, navigate the cursor to the line with the breakpoint then run :Clear.
In the gdb window
The normal gdb commands still work:
- Set a breakpoint
(gdb) break hello.cpp:15
or
(gdb) break 15
- Deleting a breakpoint: Note that when you set a breakpoint, the line number is preceded with a number indicating the breakpoint number. Since the breakpoint on line 15 is the first breakpoint we have set in this program, we can delete the breakpoint using the
deleteordelcommand that accepts as an argument the breakpoint number.
(gdb) del 1
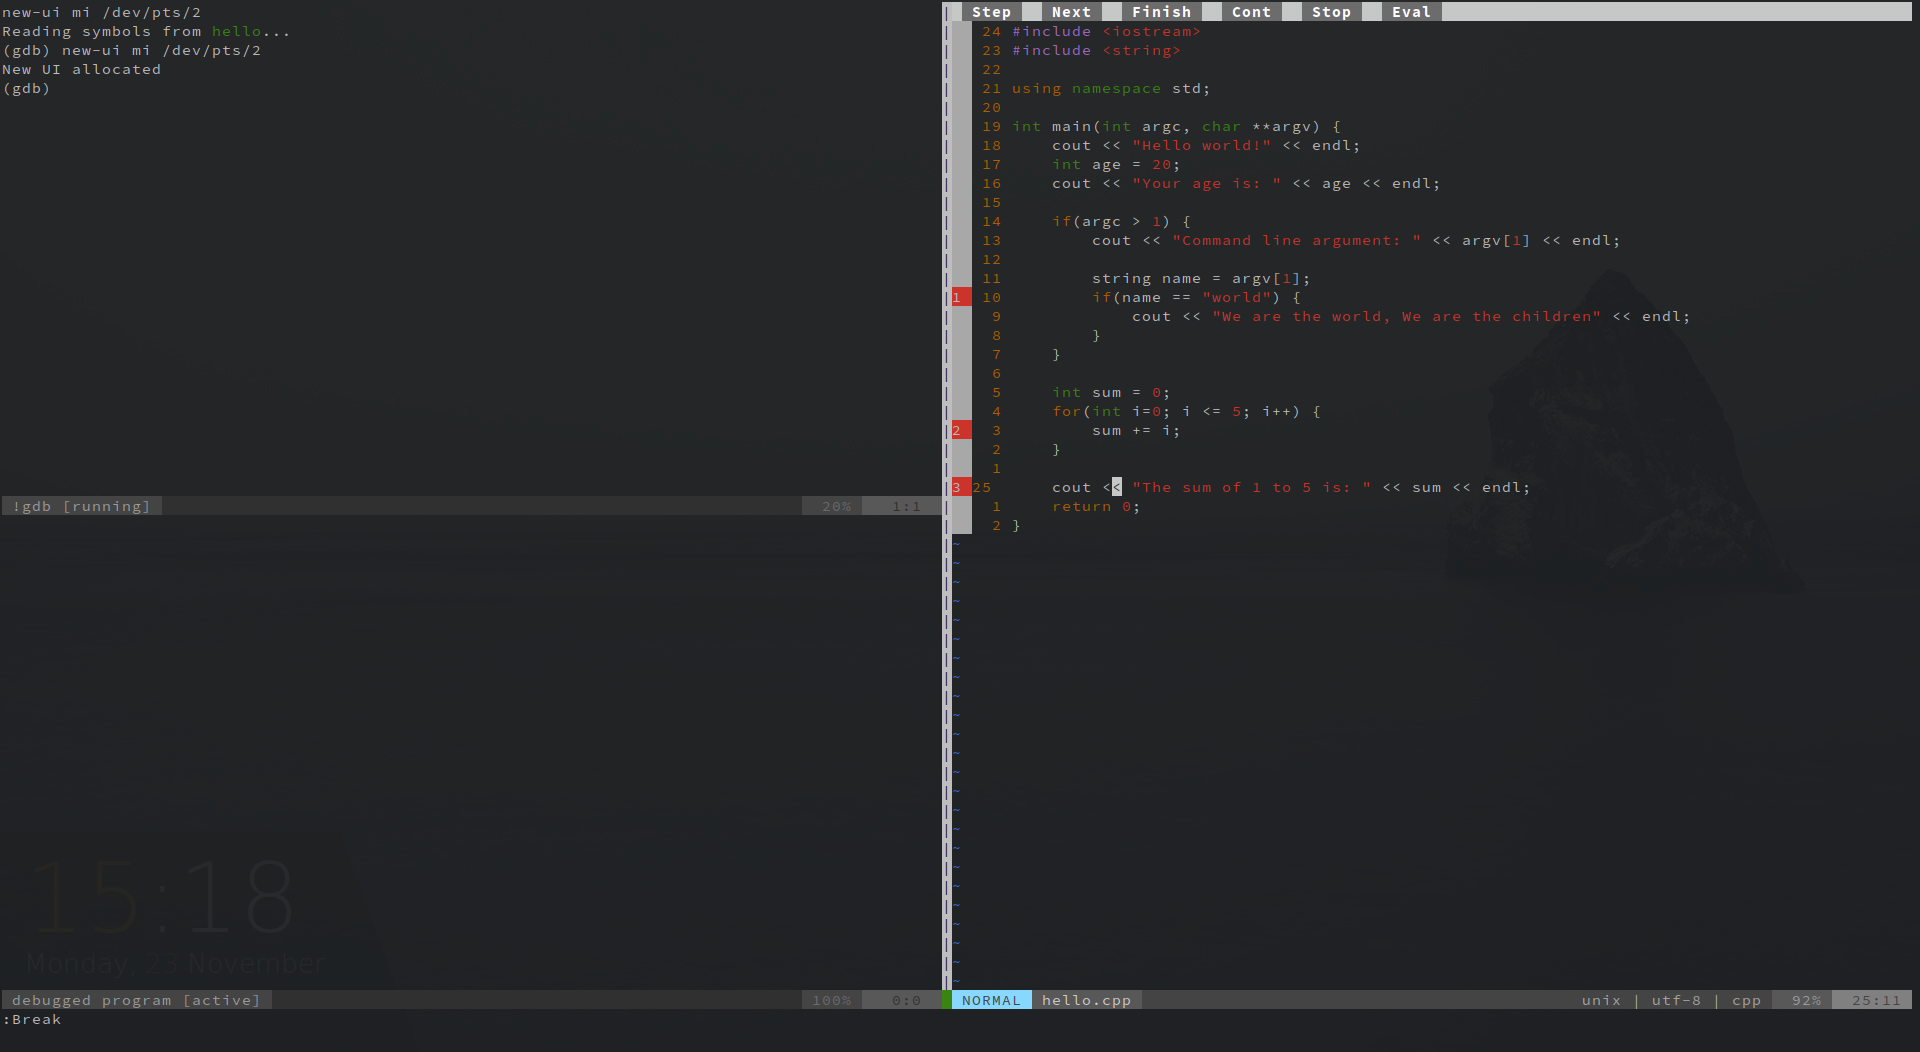
In both cases, you’ll get an indication that the breakpoint has been set by seeing the breakpoint number, in our case 1 in line 15 in the editor window. Set other breakpoints in lines 22 and 25. Your window should now look like:
Run the Program
Let us now run the program. This can be done:
- Through Vim’s
:Runor - Through
gdb:
(gdb) run
The program execution will halt at line 15.
Values of variables
- In the editor window:
You can check the value of variables by moving the cursor to them then running
:Evaluate.Evaluateby default shows the value of the variable under the cursor. This can also be achieved by pressing the keyKwhile the cursor is over the variable.
You can also pass as an argument the name of the variable whose value you want to see, for example:Evaluate age. - In
gdb’s window, you can also check the value of the variable using theprintorpcommand.
(gdb) print name
(gdb) p age
QuickTip
While checking the value of a variable, you can see
<optimized out>as its value. Most compilers do optimizations that result in the value of the variable not being seen in the debugger. If you want to see the value of the variable, you have to add thevolatilespecifier to it and then recompile the entire program again. For example:volatile double randomVariable;
Continuing with Execution
Let us now continue with our program execution. To do this, you can:
- Click on the
Contbutton on top of the editor window or - Run the
:Continuecommand in vim’s last-line mode or - Run
continueorcingdb:
(gdb) c
Now have fun as you explore the program further.